
Description
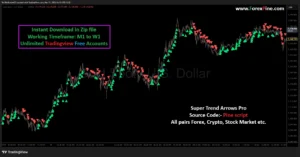
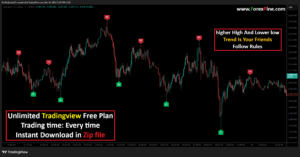
Higher High And Lower Low [Pro]
Note:- It is better to make profit by using indicators rather than making losses
Understanding market structure is the foundation of profitable price action trading. The Higher High And Lower Low [Pro] indicator is designed to strip away the noise of the charts and provide traders with a clear, visual representation of trend shifts and continuation patterns. Whether you are a fast-paced scalper or a patient intraday trader, this tool automates the tedious task of identifying structural pivot points. 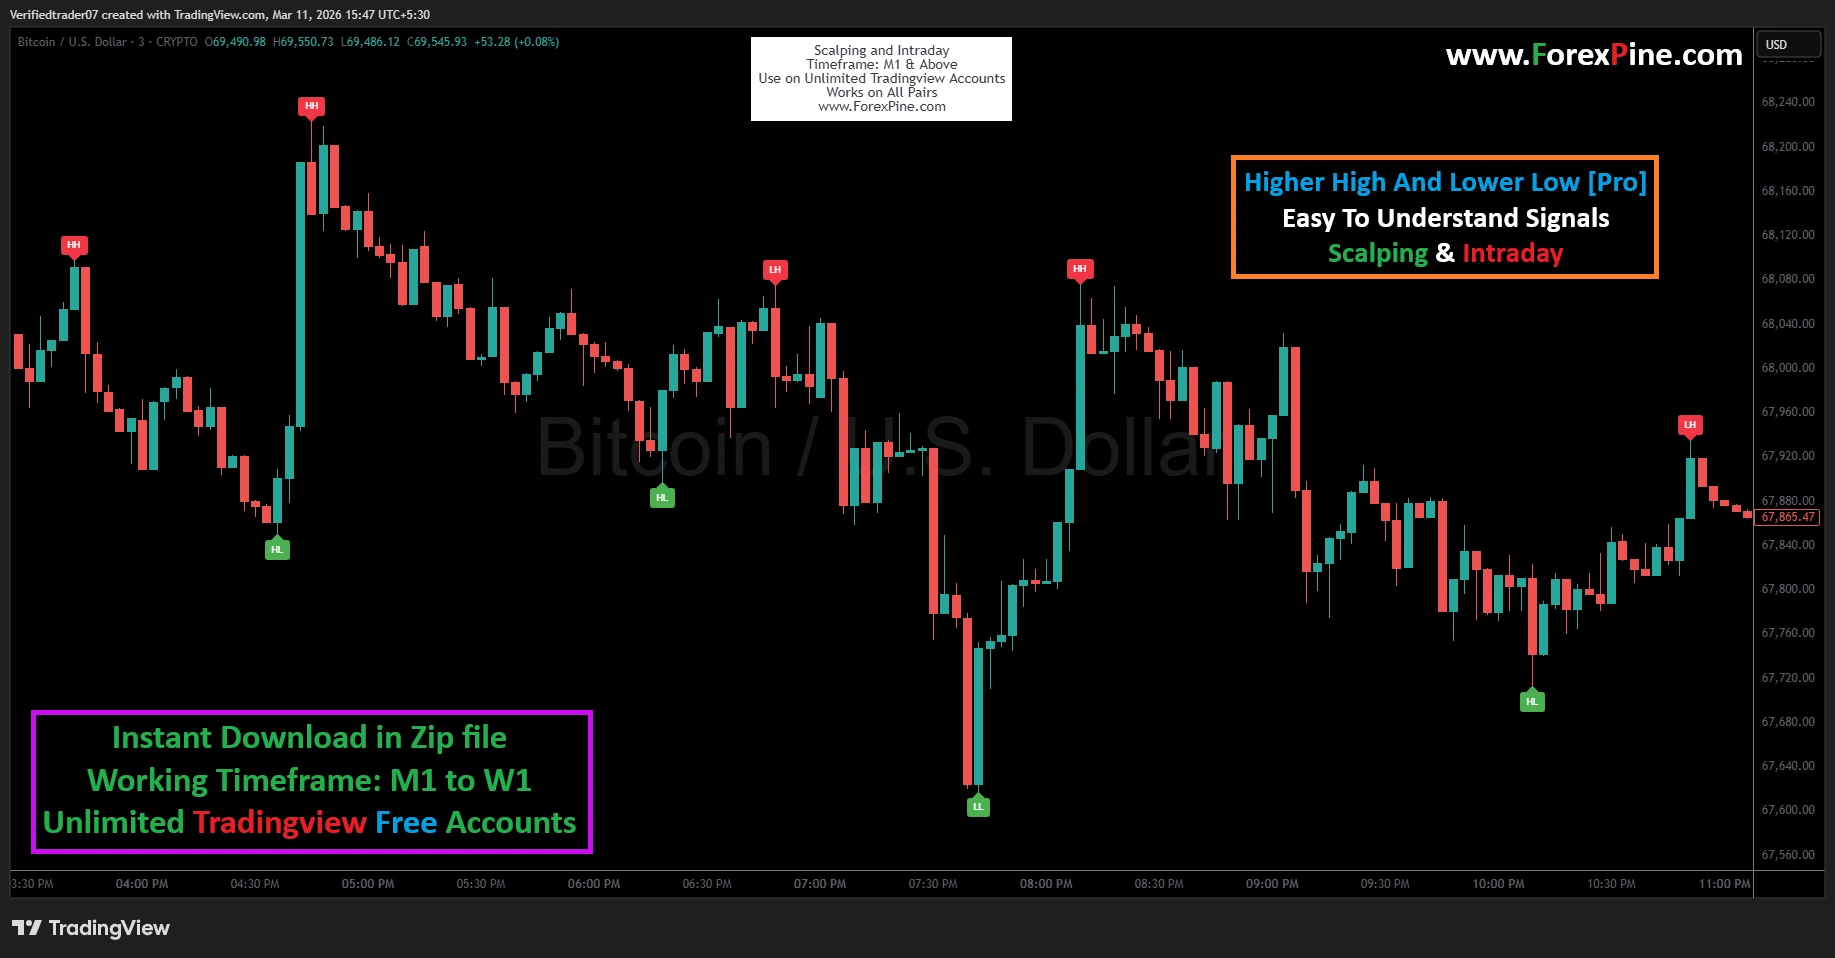
1. Indicator Overview
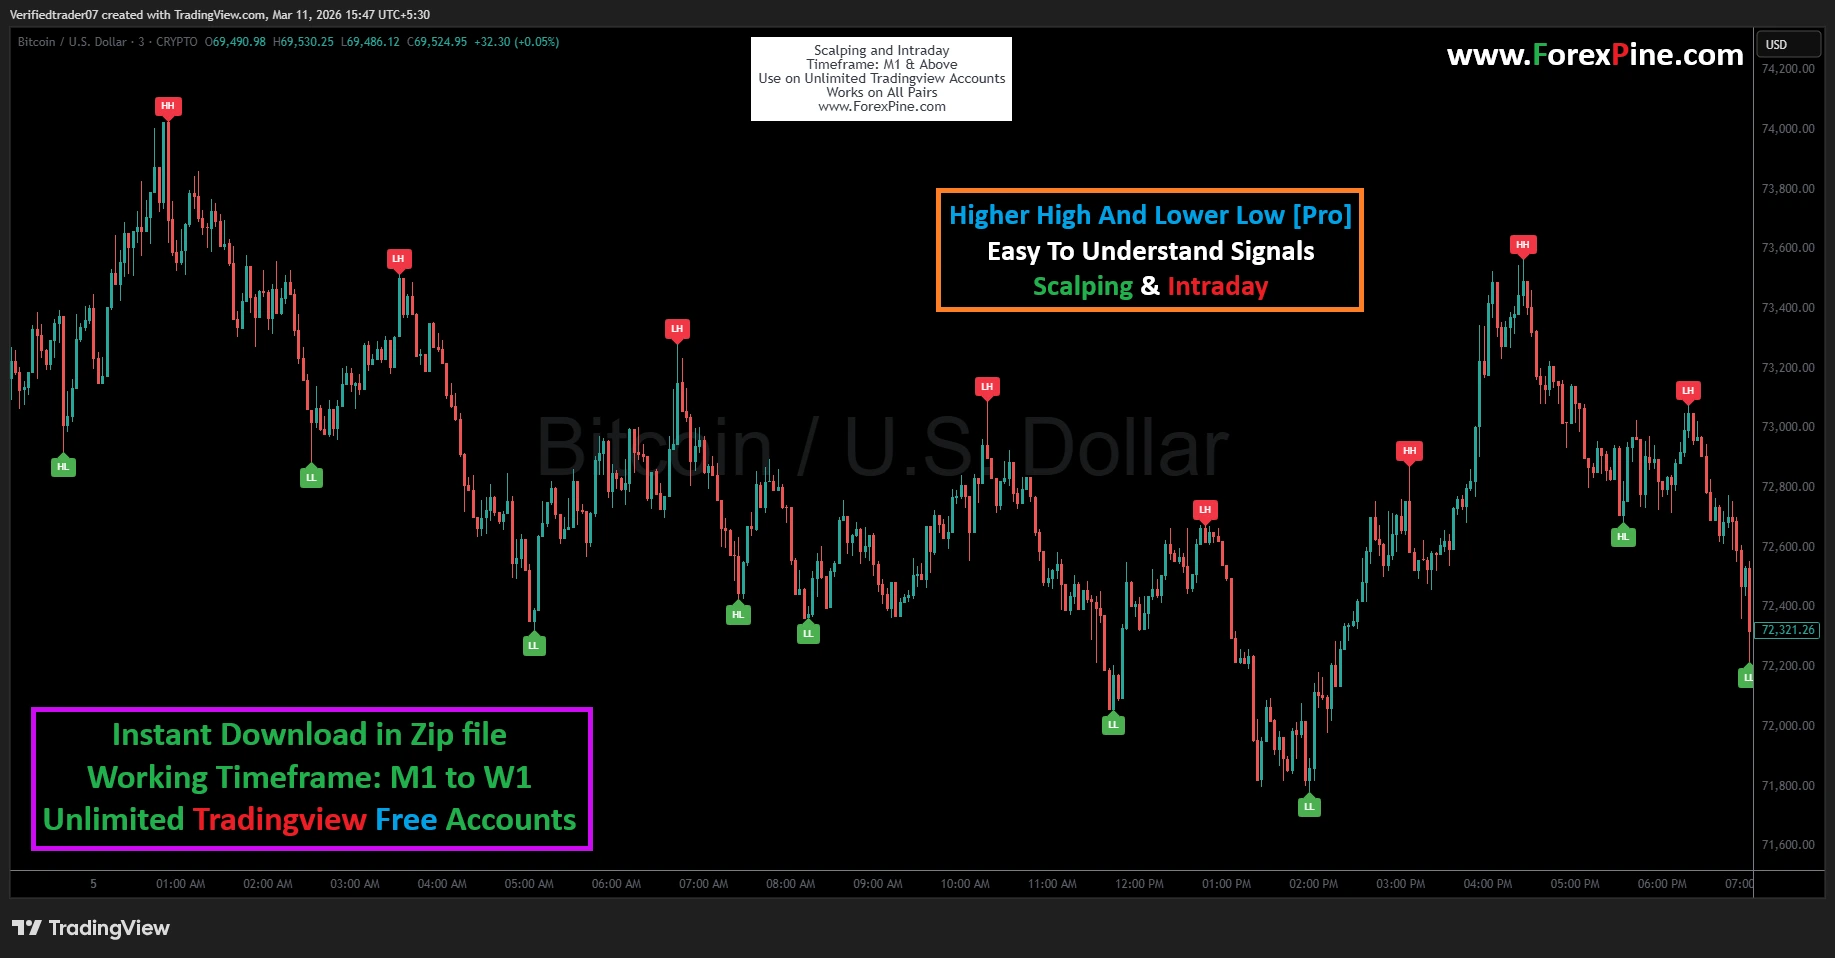
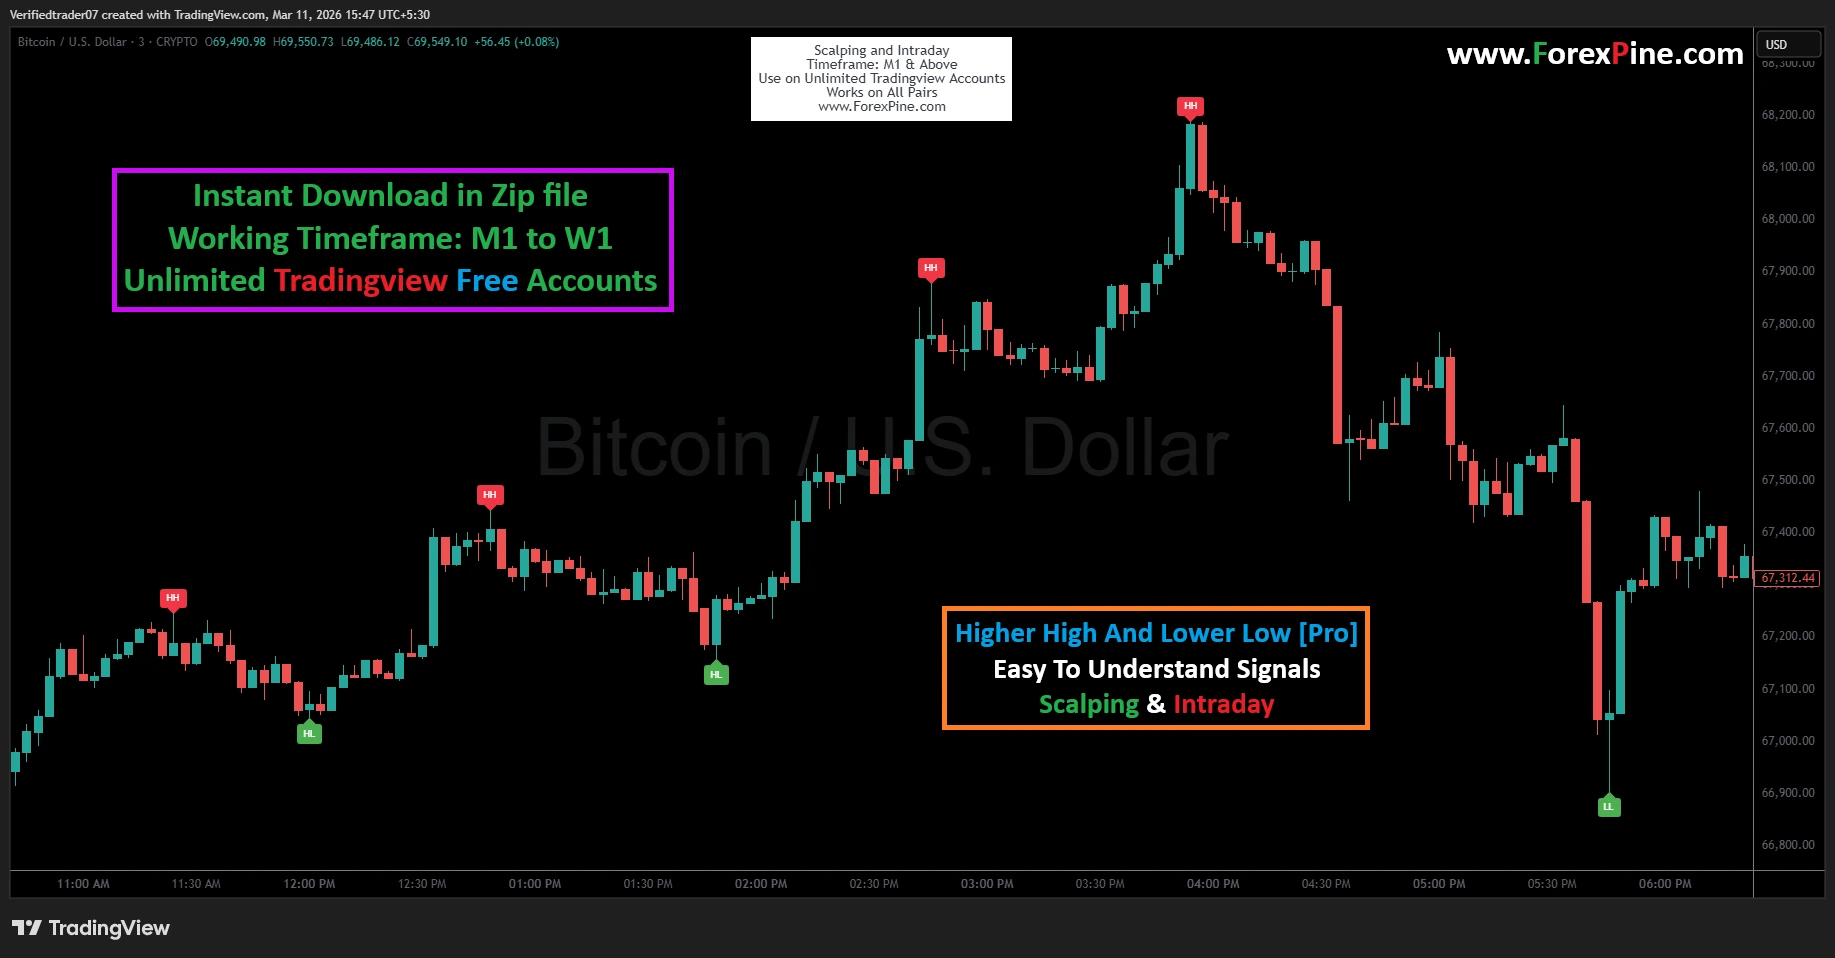
Name: Higher High And Lower Low [Pro] Primary Function: This indicator automatically labels the four critical pillars of market structure:
- HH (Higher High): A peak higher than the previous peak (Bullish).
- HL (Higher Low): A trough higher than the previous trough (Bullish).
- LH (Lower High): A peak lower than the previous peak (Bearish).
- LL (Lower Low): A trough lower than the previous trough (Bearish).
By highlighting these points, the indicator allows you to see the “DNA” of a trend at a glance, helping you identify when a trend is healthy and when it is about to exhaust. ![Higher High And Lower Low [Pro]](https://forexpine.com/wp-content/uploads/2026/03/Higher-High-And-Lower-Low-Pro.webp)
2. How to Use: Entry and Exit Signals
Trading with this indicator involves looking for “structural breaks.”
Bullish Entry (Buy)
- Setup: Wait for the price to stop making Lower Lows (LL) and print a Higher Low (HL).
- Confirmation: Enter the trade when the price breaks above the most recent Lower High (LH). This signifies a shift from a bearish structure to a bullish one.
- Stop Loss: Place your stop loss just below the recently formed HL.
Bearish Entry (Sell)
- Setup: Wait for the price to stop making Higher Highs (HH) and print a Lower High (LH).
- Confirmation: Enter the trade when the price breaks below the most recent Higher Low (HL).
- Stop Loss: Place your stop loss just above the recently formed LH.
Exit Strategy
- Trend Following: Exit when an opposing structural signal appears (e.g., if you are long, exit when a LH and LL sequence begins).
- Trailing Stop: Trail your stop loss behind every new HL (for buys) or LH (for sells) to lock in profits as the trend progresses.
3. Step-by-Step Setup Instructions
- Platform: Open your TradingView chart (compatible with both free and Pro accounts).
- Asset Selection: Choose any pair (Crypto, Forex, or Stocks). As seen in the example, it works effectively on Bitcoin (BTC/USD).
- Timeframe: Select your preferred timeframe. For scalping, use M1 or M5. For intraday/swing trading, use H1 to D1.
- Add Indicator: Search for “Higher High And Lower Low [Pro]” in the indicators tab.
- Configuration: Access the settings to adjust the “Lookback Period.” A shorter period will show more frequent signals for scalping, while a longer period will filter out noise for long-term trends.
4. The Logic Behind the Signals
The indicator is rooted in Dow Theory. A market is in an uptrend as long as it makes successive Higher Highs and Higher Lows. Conversely, it is in a downtrend when it prints Lower Highs and Lower Lows.
The logic works by comparing the current candle’s high and low against a specific number of previous candles. When the algorithm detects a peak that stands out from its neighbors, it prints the HH or LH label. This removes the subjective “human error” involved in manually drawing these levels, ensuring your analysis remains consistent across different days and market conditions. 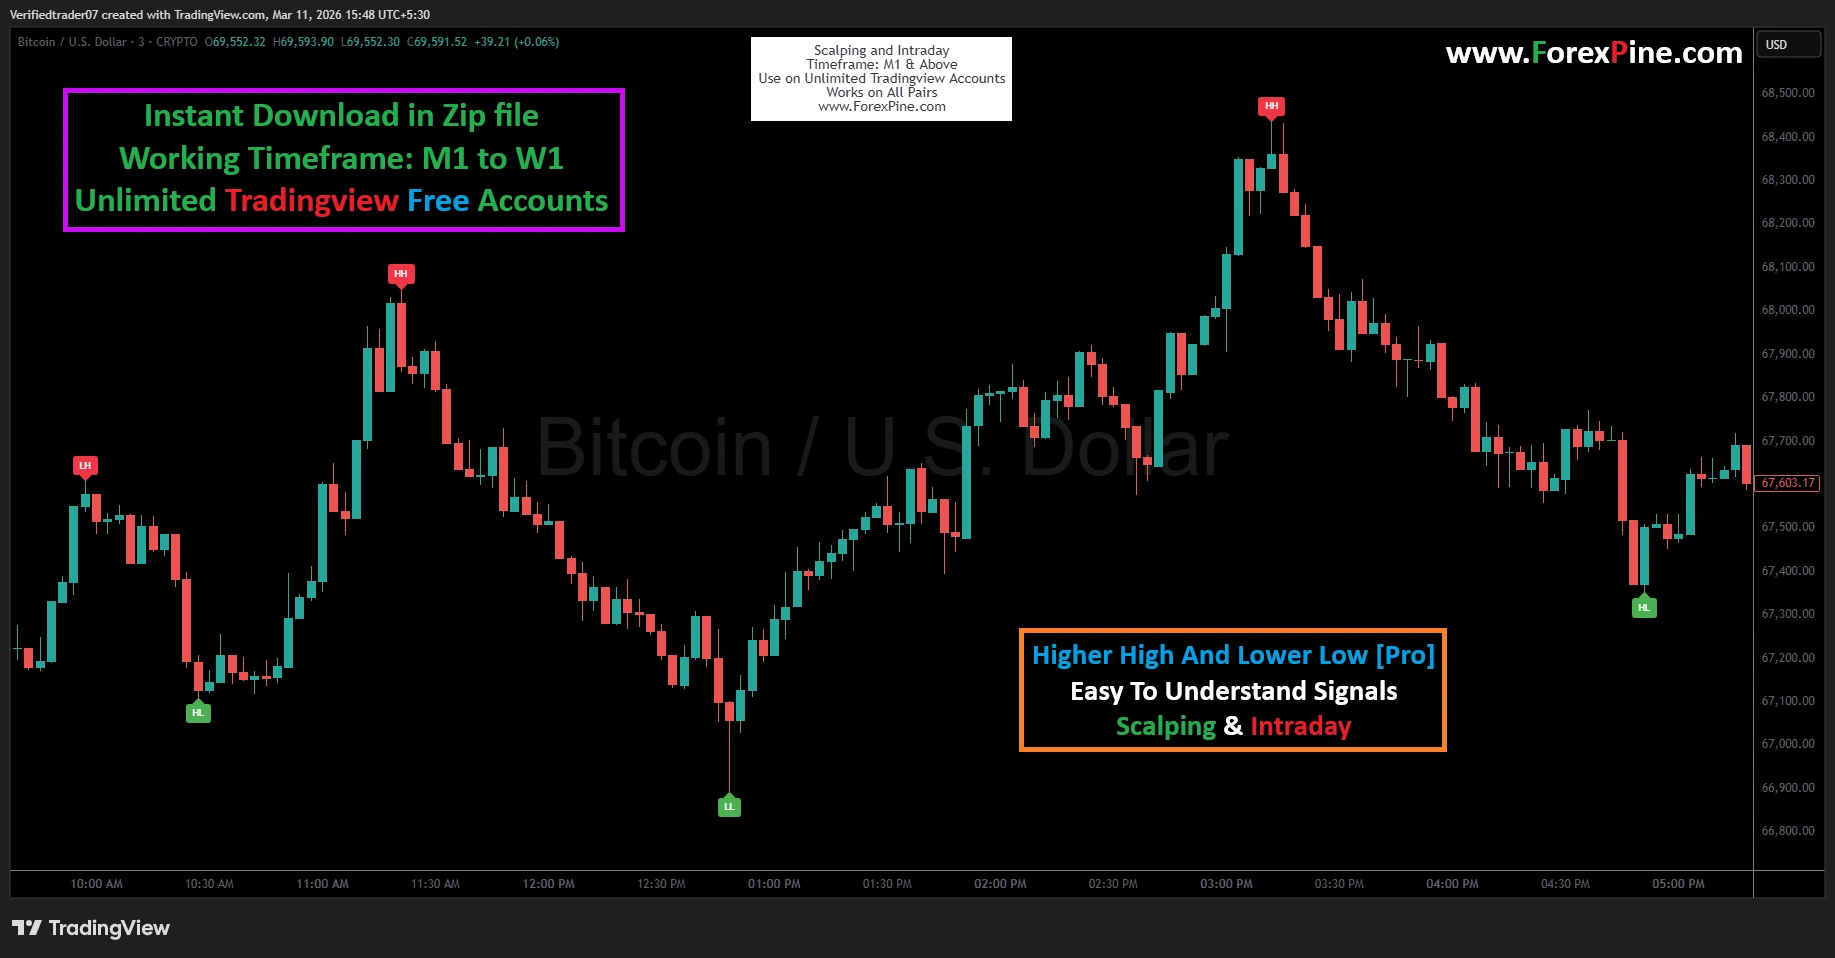
5. Pro-Tips for Maximum Accuracy
- Tip 1: The Multi-Timeframe Filter. Always check the structure on a higher timeframe (e.g., H1) before taking a trade on a lower timeframe (e.g., M5). Only take “Buy” signals on the M5 if the H1 is also printing Higher Highs and Higher Lows.
- Tip 2: Watch the “Neckline.” Don’t just trade the label. Use the labels to identify “Head and Shoulders” or “Double Top” patterns. A LH following a HH is often the “right shoulder” of a reversal pattern—this is one of the highest probability setups in trading.
- Tip 3: Ignore Signals in Ranges. If you see HH, LH, LL, and HL all appearing close together horizontally, the market is ranging (choppy). Avoid trading until the price breaks out and starts a consistent sequence of highs and lows.
Rodrigo –
Clean design and accurate signals. I use it daily on gold and forex pairs—great results so far!