
Description
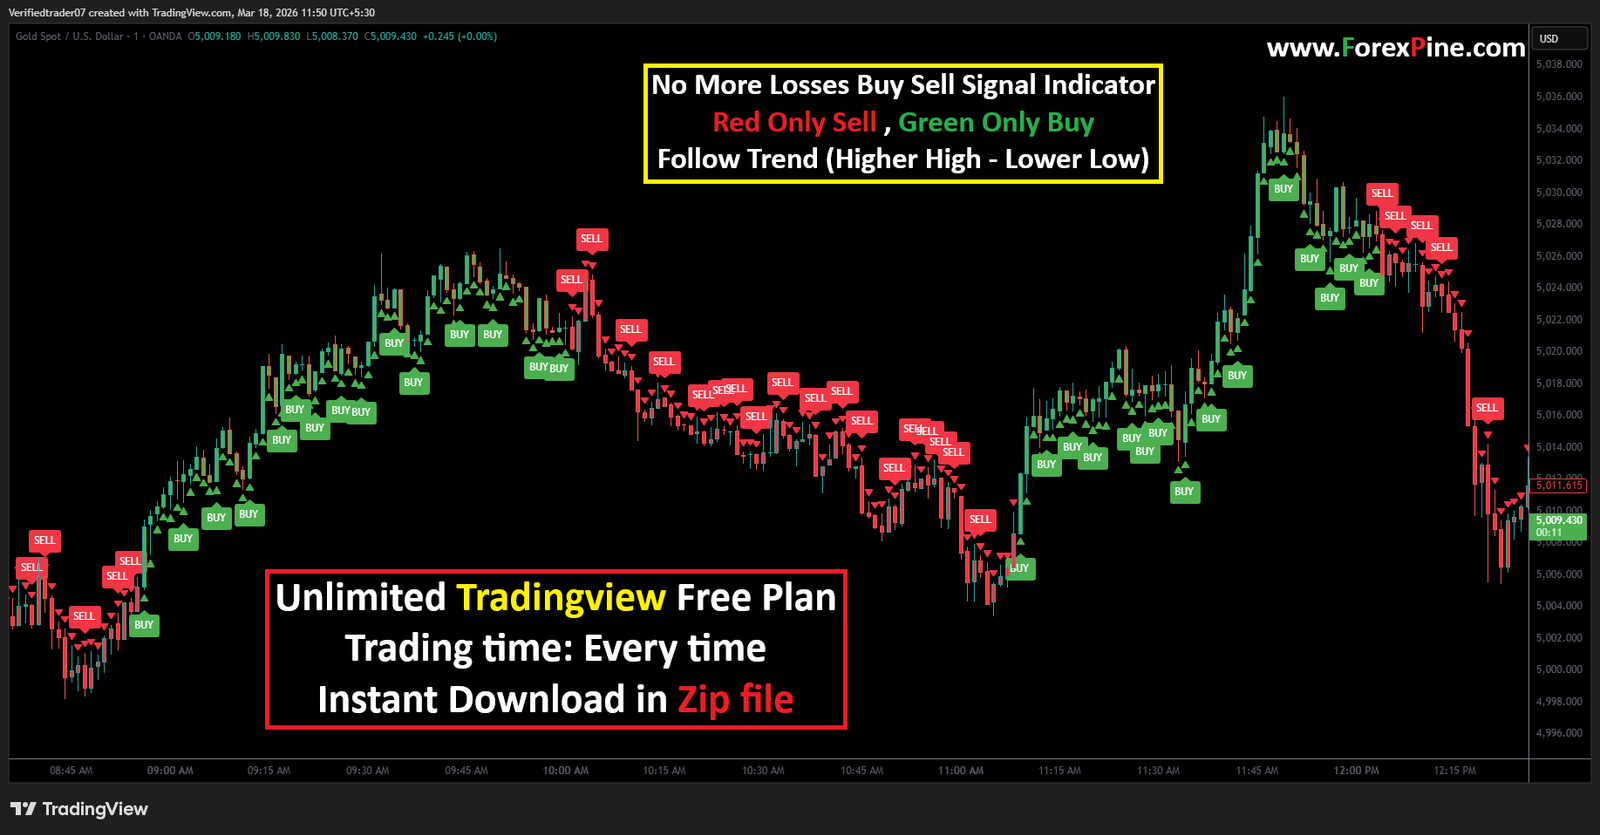
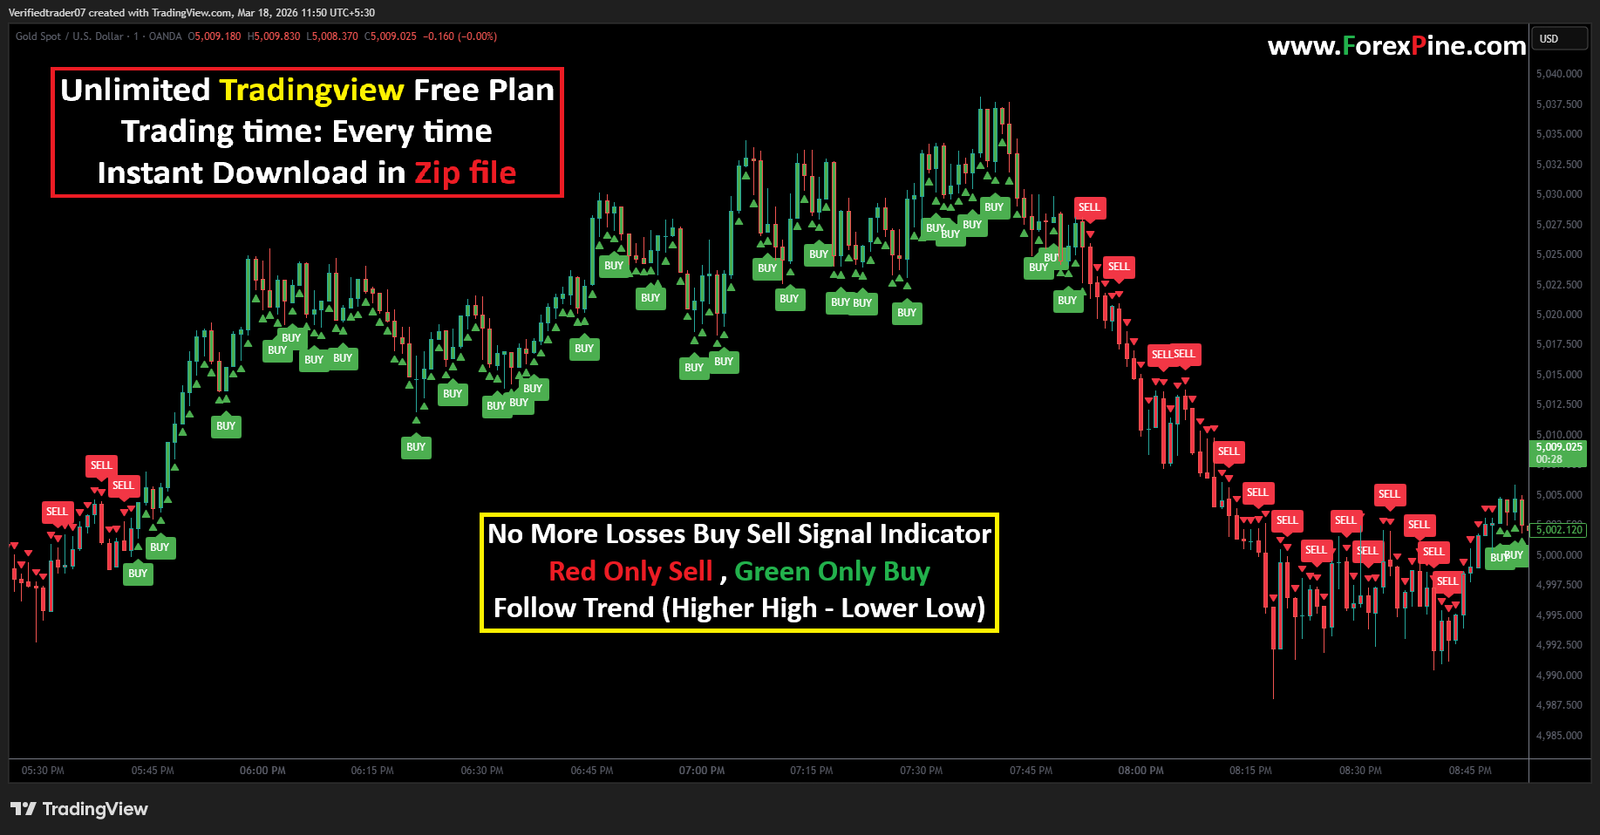
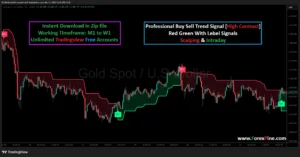
This chart illustrates a trend-following system designed for the Gold Spot (XAU/USD) market, focusing on the “Higher High – Lower Low” structure. Here is a breakdown of how to interpret these signals and manage your trades effectively.
Note:- It is better to make profit by using indicators rather than making losses
Mastering the Trend: Buy/Sell Signal Strategy
1. Identifying Entry Points
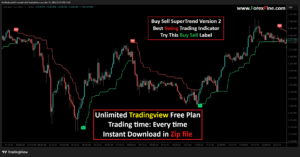
The indicator simplifies market direction through color-coded labels and visual structure cues.
-
Buy (Long) Entry: Look for the Green “BUY” labels. These appear during an uptrend when the market is printing higher highs and higher lows. An ideal entry occurs at the start of a green cluster after a period of consolidation or a red-to-green flip.
-
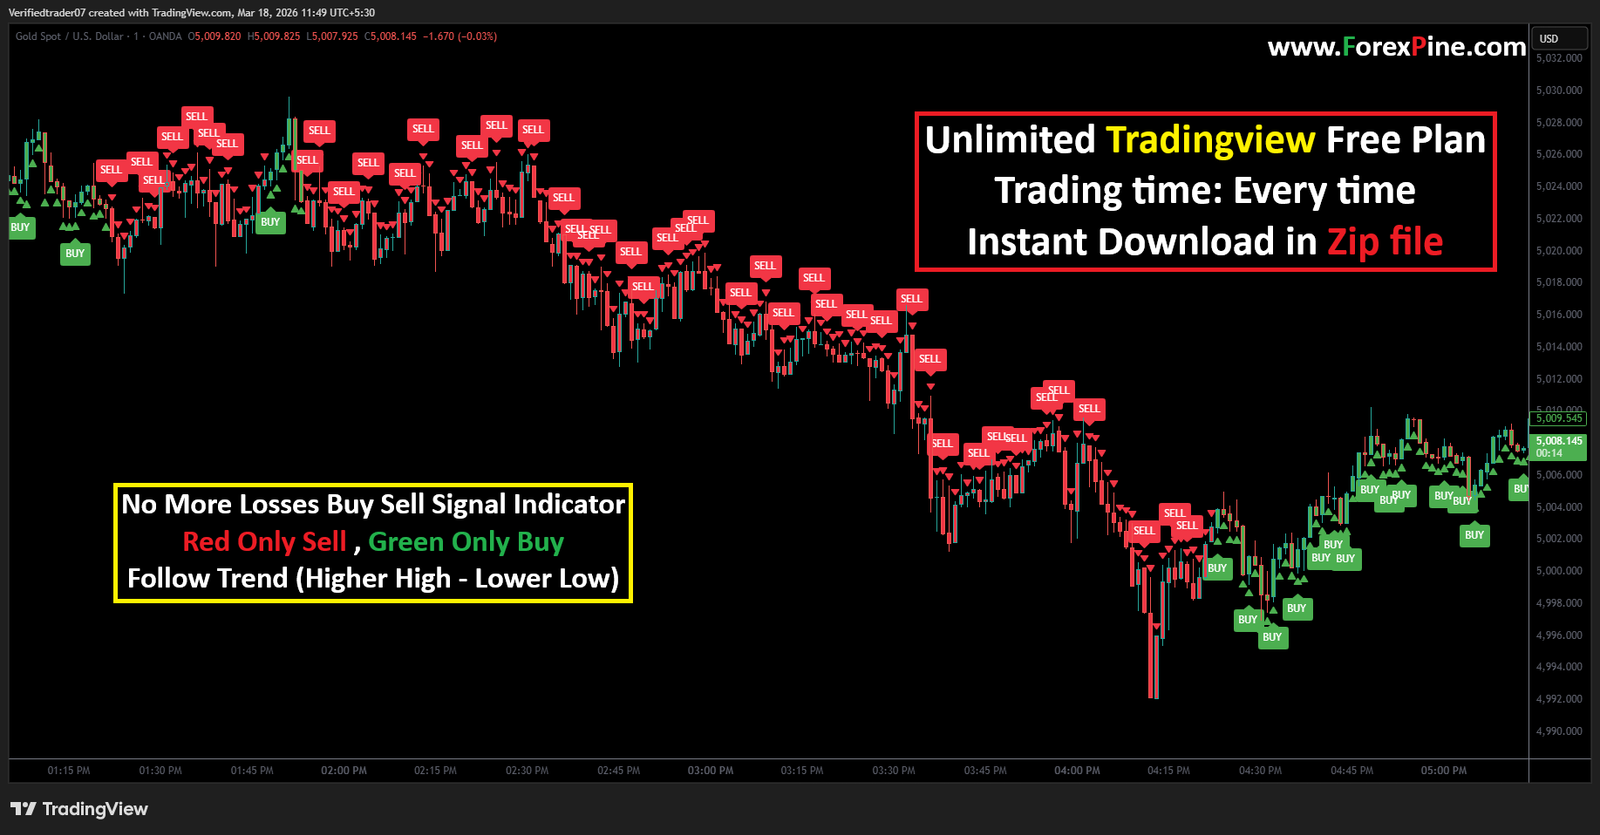
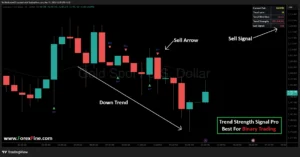
Sell (Short) Entry: Look for the Red “SELL” labels. These trigger during a downtrend. As seen in the large move in the center of the chart, the most profitable entries happen when the price breaks a previous “Lower High” and begins a sustained downward sequence.
2. Setting Your Exit Points
Knowing when to leave is just as important as when to enter.
-
Take Profit (TP):
-
Fixed Ratio: Aim for a minimum risk-to-reward ratio of 1:2. For every $10 you risk, you should aim for $20 in profit.
-
Signal Flip: A common strategy is to exit a Buy position as soon as the first “SELL” label appears, or vice versa.
-
-
Trailing Stop: To maximize profit during long runs (like the central downtrend shown), move your stop-loss manually behind each new “Lower High” (for sells) or “Higher Low” (for buys).
3. Risk Management & Stop-Loss
Trading Gold is volatile; protecting your capital is the only way to achieve consistent profits.
-
Stop-Loss (SL) Placement:
-
For Buys: Place your SL just below the most recent “Higher Low” or the swing low of the entry candle.
-
For Sells: Place your SL just above the most recent “Lower High” or the swing high of the entry candle.
-
-
The 1% Rule: Never risk more than 1% to 2% of your total account balance on a single trade. If your account is $1,000, your maximum loss per trade should be $10 to $20.
4. Strengths of the Indicator
This tool excels in specific market conditions:
-
Trend Visualizer: It filters out the “noise” of small price fluctuations, helping you stay in a trade as long as the trend remains intact.
-
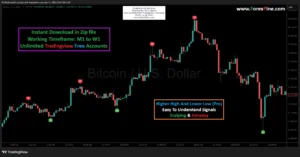
Structure-Based: By following “Higher Highs and Lower Lows,” it aligns with the core principles of price action trading.
-
Psychological Ease: The clear “Red/Green” labels help reduce the emotional hesitation often felt when deciding to pull the trigger on a trade.
Pro-Tip for Consistency
Avoid “choppy” or sideways markets where the labels flip between red and green rapidly in a tight range. This indicator is most powerful when the market is clearly “stair-casing” up or down. Always confirm the signal on a slightly higher timeframe (e.g., if trading on the 1-minute, check the 5-minute) to ensure you are trading with the overall market momentum.
Reviews
There are no reviews yet.